Why You Should Care About Burnout (Even If You Don't Think You Have To)
Every year, we collect so much data through our Community Surveys that it is impossible to touch on...
We often ask our partners: If you have limited budget, energy, and resources to improve employee well-being, what are the one or two things you can do that would have the largest impact?
If you've asked yourself that question, then you’re already asking the right questions. The answer starts with how you use your people data — and more specifically, how you disaggregate it.
I get it. "Disaggregated data" sounds nerdy enough to stop reading, but stick with me. Really, it's just a fancy label for breaking down survey results by meaningful groups — like department, location, tenure, or demographics.
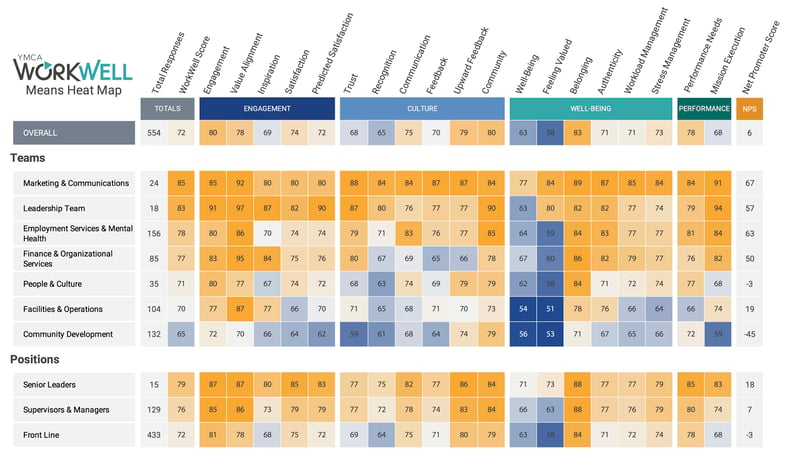
For example, when you receive your results from our Employee Insights Survey:
Breaking your data down transforms your ability to act. It lets you move from broad assumptions to targeted, high-impact interventions.
Imagine this scenario: You run an employee engagement survey with 24 employees and discover that 50% of your people don’t feel valued at work. That’s a big deal.
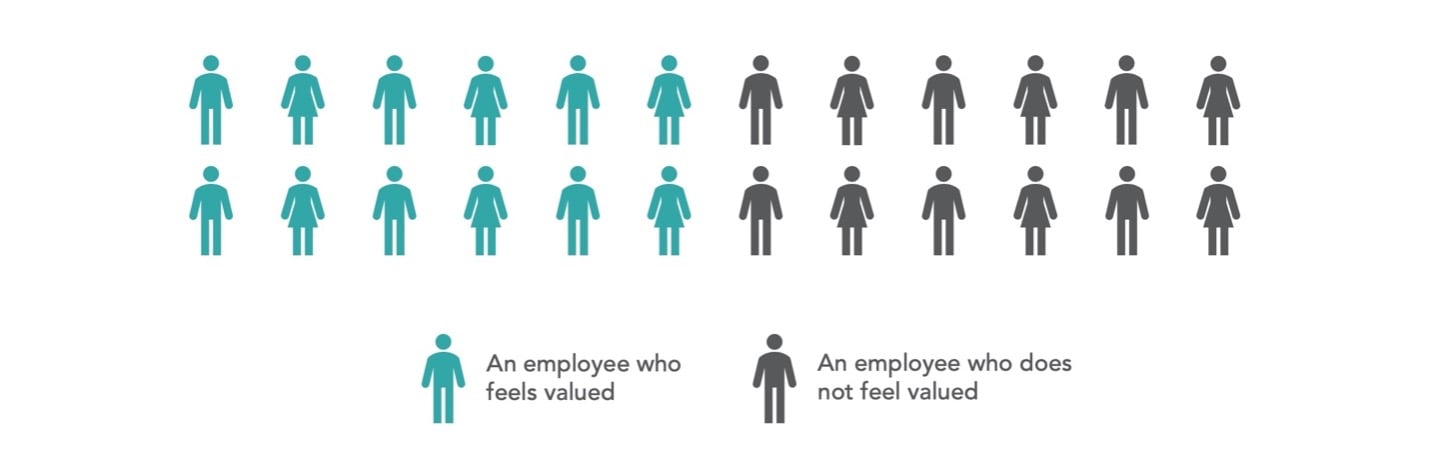
But where do you go from there? The big question is: what do you now do as a leader to create the most significant impact? Let's consider three very different possibilities in your data.
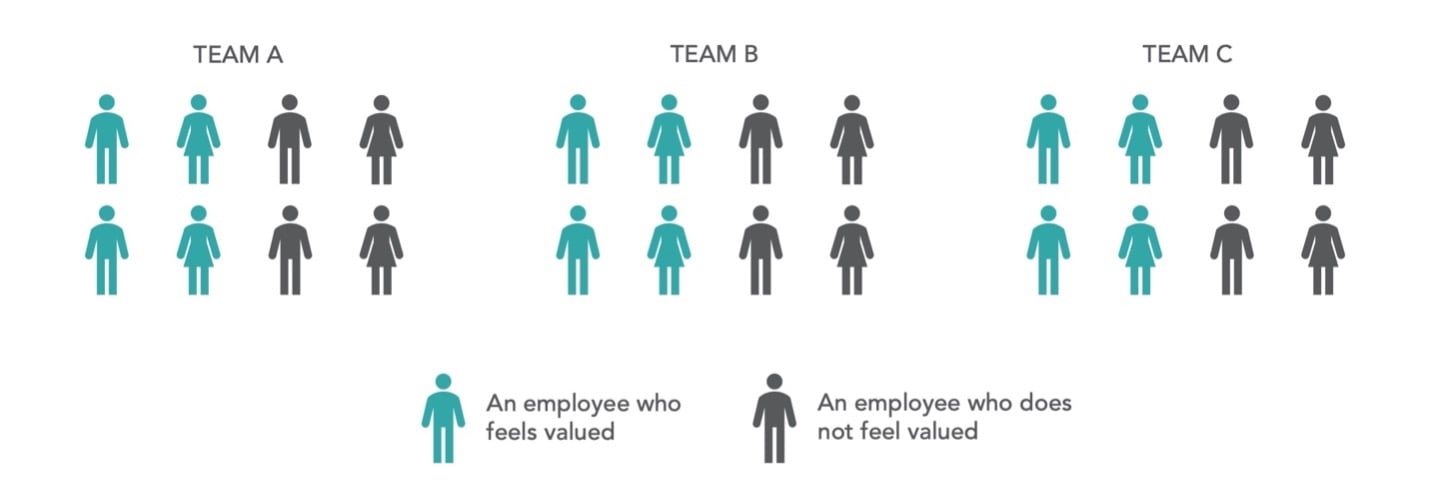
Each team reports the same issue - half of the employees in every department feel undervalued.
That’s your cue for a culture-level intervention: recognition programs, leadership training, or redefining values from the top down.
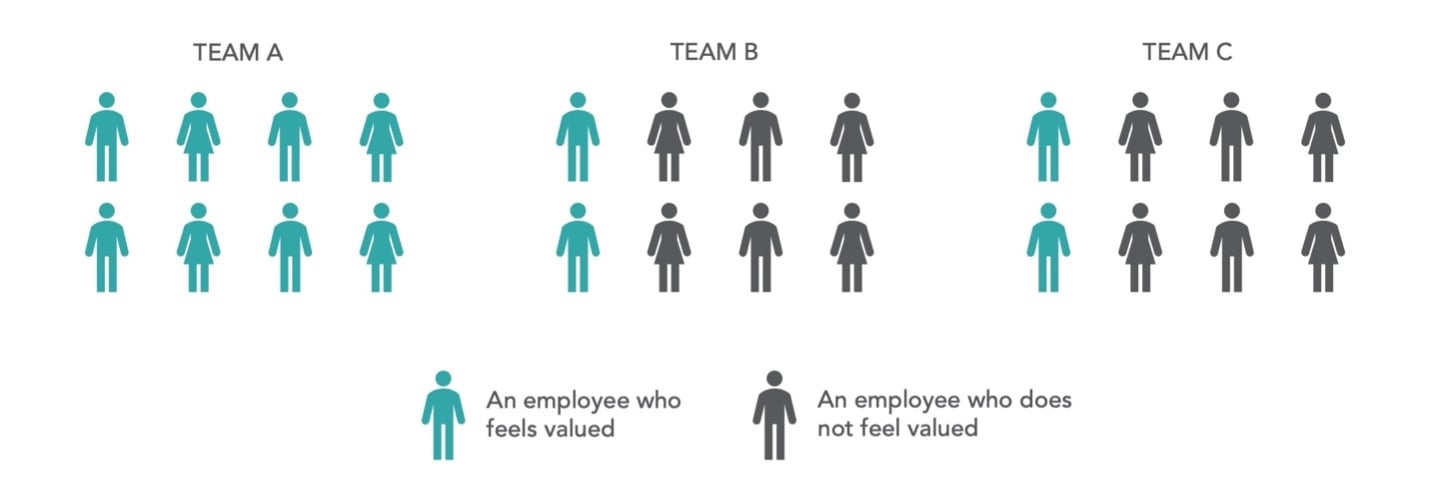
Team A is thriving. Teams B and C? Not so much. Here, you don’t need a full-company strategy — you need to equip specific managers with the tools and support to lead more effectively.
What if 75% of women feel undervalued, while 75% of men feel the opposite? This isn’t just about teams — it’s about systemic gaps. In this case, your focus should shift to Equity, Diversity, and Inclusion strategies that address the root causes of those disparities.
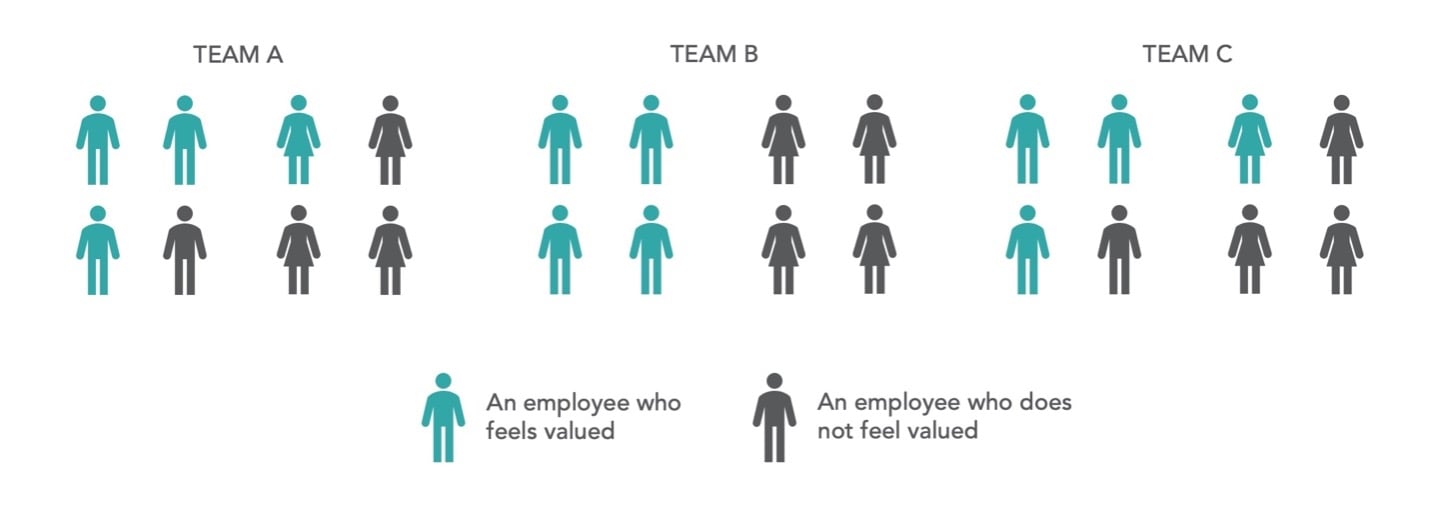
A single average score only tells part of the story - and the scenarios above illustrate just how complex one insight can be. But when you slice the data by team, identity, or role, you uncover patterns that actually help you lead better.
This is where disaggregation becomes a your key to impact — turning one insight into the right action, in the right place, at the right time.
With our WorkWell Insights, this is our bread and butter. We help leaders:
Because Insights are only as good as the impact they create. And it's our job to help you find the one or two actions that will give you the biggest bang for your buck.
If you’re trying to stretch a limited budget, team capacity, or timeline, there’s one question you should always ask:
“Where can we focus that will make the biggest difference?”
Disaggregated data gives you that answer - and it’s the difference between making a small dent and creating meaningful, measurable change.
Want to learn more about how we help you make the best data-driven decisions? Are you curious how your own organization would show up on that heat map? Let’s talk. We’re looking forward to helping you use and act on your data better.

Dr. Dave Whiteside is the Director of Insights at YMCA WorkWell. Armed with a Ph.D in Organizational Behaviour, he helps leaders turn complex data into meaningful action and has delivered over 1,500 Insights Reports to leaders from small startups to international organizations - always with the goal of telling powerful stories with data to build healthier workplaces and healthier communities. He is a self-titled "cool dad", he takes gratitude very seriously, and he will never, ever miss giving a deserved high five.
Every year, we collect so much data through our Community Surveys that it is impossible to touch on...
Burnout has become the workplace buzzword of the decade — and for good reason.
Every year, we collect so much data through our Community Surveys that it is impossible to touch on...